
Modern societies are technologically brittle. They rely on a wide range of technologies for national security, economic prosperity, and public health and safety, but that technology usually lacks resilience to cyber-based threats. Failures cascade rapidly and unpredictably, and data theft, frauds and scams, and business interruptions impose significant costs on the global economy. Cyber-enabled espionage and critical infrastructure intrusions threaten national security and most cybersecurity experts predict that things will only get worse. Despite all this, however, we don’t actually know how bad the problem is at the national level because we lack national cyber metrics.
The overwhelming consensus about the state of cybersecurity is based on remarkably limited empirical data. Policy makers have long lacked national cyber metrics to use in decision-making. Is the problem really getting worse, as media headlines would lead one to believe? Which organizations are suffering the most damage? Which policy actions or regulations improve a nation’s cybersecurity? Which companies are the most critical to protect from disruption? Agreeing on a set of metrics that illuminate the answers to these questions would provide a more solid foundation for policy decisions and actions.
So why can’t governments measure cybersecurity like the economy? The problem is not a lack of measurable indicators. As a cursory web search will demonstrate, we are awash in possible metrics. Instead, the challenge is picking useful metrics that balance:
- Coverage – enable effective risk management in all critical national functions.
- Relevance – inform the decisions a government makes.
- Data availability – have data to support them.
- Manageability – are limited to the number of inputs decision makers can handle.
Based on these factors, this paper proposes five national cyber metrics for a cybersecurity dashboard: 1) the percentage of currently exploited vulnerabilities that are more than a year old, 2) the number of significant cyber incidents per reporting period, 3) the mean time to contain malicious cyber activity, 4) the total economic loss to society due to cyber incidents, and 5) the percentage of unfilled cyber positions. These metrics would inform decision-makers about changes in cyber defenses and threats, whether government policies are reducing cyber-based harms, and how to allocate resources effectively. Over time, these metrics should be reviewed for effectiveness and whether additional metrics warrant inclusion on a national dashboard.
This paper builds on work by Jason Jason Healey at Columbia University, Yurie Ito at Cyber Green, and World Economic Forum’s Global Future Council on Cybersecurity.
Selecting metrics for a dashboard
Coverage
Cybersecurity professionals consistently recommend that companies use a risk management framework. Using such frameworks is critical because organizations can never be perfectly secure; no matter how much money or attention an organization puts into cybersecurity, some residual risk will remain. The same is true at the national level. A nation can reduce its cyber risk, but it can never drive that risk to zero.
In addition, cybersecurity involves more than deploying firewalls or running network scans. It also involves law and policy, response planning, and communications, among other things. Therefore, aligning potential metrics with a risk management framework helps ensure that a dashboard covers as much of the risk management functions as possible given other constraints. This approach also ensures that the metrics are not concentrated in a single area.
In the US, the most widely accepted cyber risk management framework is the National Institute of Standards and Technology’s Cybersecurity Framework (NIST CSF), which incorporates six functions: identify, protect, detect, respond, recover, and govern. In selecting metrics, this paper focuses on those that clearly align with one of these functions, aiming for as much coverage as possible.
Relevance
Governments regularly make many decisions affecting cybersecurity, including establishing laws, regulations, and policies; allocating resources; developing and deploying capabilities; and imposing costs on malicious actors. The selected national cyber metrics should inform decisions for as many of these activities as possible.
Data Availability
Data has to be obtainable for a metric to be viable. For example, the percentage of malicious cyber activity prevented would be a great metric. The problem is that the denominator in that percentage, the total amount of malicious activity, cannot be known with any degree of certainty, which makes that metric useless. Accordingly, this paper identifies a set of national cyber metrics for which data is either readily available now or could be compiled through national reporting requirements.
Manageability
Research shows that senior leaders can only manage a limited set of metrics, typically between 3 to 10 for a given topic.[1] Therefore, a national cyber metrics dashboard can only reasonably include a handful of measures. However, since even ten metrics cannot provide a holistic view of every relevant aspect of cybersecurity for complex ecosystems, a national dashboard cannot be the only tool decision-makers use to manage cyber risk. If the dashboard shows cause for concern, then decision-makers should seek additional data to determine the specific nature of the problem and choose an appropriate course of action.
The Top cyber metrics
This paper identifies five national cyber metrics aligned with the NIST CSF that provide meaningful insight while balancing the factors described above. It offers a metric for five of the six CSF functions, excluding Identify. In developing this paper, we were unable to find a viable metric for this function; accordingly, we recommend further study to determine an acceptable proxy metric.
Protect: Proportion of exploited vulnerabilities older than one year
The Protect function covers the ability to safeguard assets and lower the likelihood and impact of adverse events. A better protected ecosystem will have fewer vulnerabilities overall and the remaining vulnerabilities will be mitigated in a timely manner. As a result, malicious actors will be forced to abandon older vulnerabilities and use newer vulnerabilities to achieve their goals. Therefore, as the share of exploited vulnerabilities greater than a year old compared to the total number of exploited vulnerabilities decreases, the better protected the ecosystem. This metric provides insight into the strength of ecosystem defenses and how they are changing over time.[3] If the percentage of old exploited vulnerabilities is not dropping as rapidly as desired, policy makers could choose to allocate more resources to retiring legacy technology. Industry sources like the Exploit Prediction Scoring System, the Verizon Data Breach Report, and Veracode could provide data to support this metric.
Detect: Number of significant cyber incidents per reporting period
The Detect function encompasses the timely discovery and analysis of adverse cyber incidents. Tracking the total number of cyber incidents across an entire country is impossible from a practical standpoint, but governments can require a defined subset of organizations to report cyber incidents that meet a certain minimum threshold in terms of economic damage, number of affected citizens, or services interrupted. This reporting on significant cyber incidents would provide insight into the overall rate of cyber incidents across a society. It could be reported for whatever time period decision-makers want, whether monthly, quarterly, or annually. In addition, the frequency and scale of significant cyber incidents should drive decisions about policies, capabilities, resource allocation, and cost imposition. Data to support this metric would be available through reporting requirements mandated in the Cyber Incident Reporting for Critical Infrastructure Act, the European Union’s Network and Information Security 2 regulation, and similar laws or regulations in other countries.
Respond: Mean time to containment
The Respond function covers the actions taken to address a cyber incident after it occurs. The faster an organization can respond, the less damage it will incur. Therefore, the key metric for this function is mean time to containment – on average, how long does it take organizations to stop malicious activity once it is discovered. The goal is to have the time period be as short as possible. Data to support this metric could come from incident response companies like Mandiant or Crowdstrike, or from the Verizon Data Breach Report.
Recover: Economic loss due to cyber incidents
The Recover function covers the activities needed to restore normal operations after a cyber incident. The majority of cyber incidents stem from cybercrime, which includes ransomware attacks, cyber-enabled scams and fraud, and data and intellectual property theft. This criminal activity diverts resources away from legitimate economic activity and creates a drag on almost every economy around the world. Since cyber disruptions degrade national security, economic prosperity, and public health and safety, nations want to restore normal operations as quickly as possible. Therefore, a key metric is the economic cost of cyber incidents.This metric would be particularly useful in conducting cost benefit analysis for cybersecurity policies or for weighing cost imposition activities. It could be calculated in several ways, including direct dollar estimates or person-days of disruption; further analysis will be needed to refine this metric. Data to support this metric would be available through reporting requirements mandated in the Cyber Incident Reporting for Critical Infrastructure Act and associated regulations.
Govern: Number of Unfilled Cybersecurity Positions
At the national level, the Govern function translates into having effective legal and policy frameworks to incentivize cyber security investment and ensure that the country has sufficient cyber security capabilities to manage its risk. Since a society cannot manage its cyber risk effectively without a sufficient number of skilled cybersecurity personnel, this metric provides a proxy for how well a country can meet the ‘Govern” function. Data for this metric can come from a number of sources, including government agencies like the Office of Personnel Management and private sector companies like Burning Glass or Cyberseek.
Direction and Targets
In using these five national cyber metrics, trends over time will likely matter more than the absolute numbers on any given date. For example, knowing that the percentage of exploited vulnerabilities older than one year is steadily decreasing is probably more important than the specific percentage at a given point in time. Therefore, the direction and rate of change will usually provide more insights than the data points by themselves.
Metrics can only help inform decisions if targets are established and measured against. Since experience with metrics is lacking, there are few benchmarks to turn to right now. For example, what is the “right” percentage of exploited vulnerabilities older than a year? Zero? Five? Seven? It will take time to determine the correct targets and particularly at the start, the targets may be arbitrary. Further, targets may change over time based on experience or new data, but should only be updated infrequently in order to maintain their validity.
How to present the metrics
After selecting national cyber metrics and targets, decision-makers need to be able to use metrics in policy making. Since we know that people can evaluate information more effectively in a visual format, policymakers should use a simple dashboard to track vital signs and respond in real-time. Visualizations help decision-makers, organizations, and citizens understand cyber health and hold governments accountable. A sample dashboard is below.
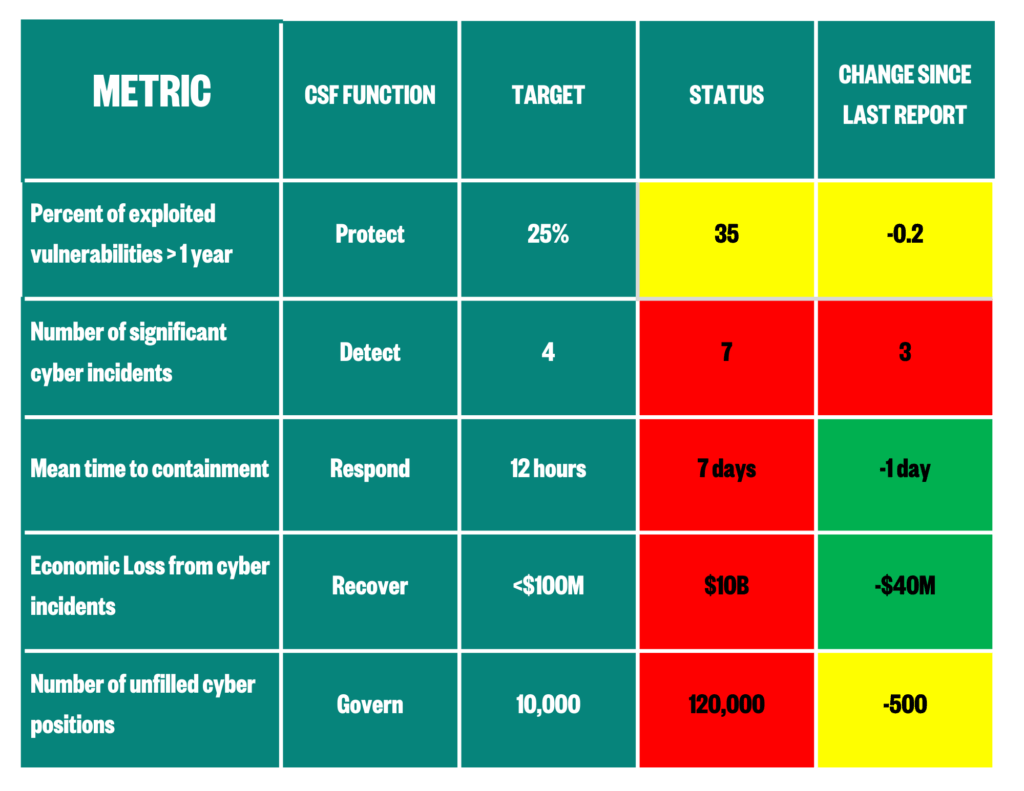
Data in this chart is illustrative.
Where do national cyber metrics go from here
Any limited set of metrics will have weaknesses: gaps in coverage, limits to explanatory power, confounding factors. However, the proposed national cyber metrics provide a snapshot into a nation’s cyber “health” and whether it is improving or worsening over time. They provide a more solid foundation for policy decisions and resource allocations. Governments should start collecting the necessary data, building the commensurate dashboards, and updating the information regularly. Governments could then adjust the targets or even select new metrics based on their experience.
These metrics fail to address certain issues, particularly in the “Identify” risk management functions of the CSF. For example, how does a government assess whether it has properly identified the IT or OT systems that support the most critical functions? What metric would show whether a government is getting better or worse at responding to significant cyber incidents? How do governments measure the impact of cost imposition on malicious cyber actors? We need further work to develop a set of metrics that would provide insight into these questions.
If what gets measured gets done, then countries need the best possible national cyber metrics to make sure the right things are getting done. Selecting metrics will always involve a degree of judgement but refining the chosen metrics or even switching out metrics based on empirical results will produce better outcomes. As with cybersecurity itself, choosing cyber metrics is hard, but not impossible with the right commitment and mindset. The cyber threats societies face have long-since matured; it’s time for our cybersecurity measurements to do the same.
[1] A web search will turn up dozens of articles on this topic. See for example: Too Many https://cfo.university/library/article/too-many-kpis-shortlisting-why-you-need-it-and-how-it-works-smithKPIs? Shortlisting: Why you need it and how it works | CFO.University
[2] This paper builds on work by Professor Jason Healy in Lawfare (https://www.lawfaremedia.org/article/are-cyber-defenders-winning) and at Black Hat, the author’s discussions with the World Economic Forum’s Global Future Council on Cybersecurity, a Zurich Reinsurance paper https://www.zurich.com/insights/business/cyber-metrics-for-key-decision-makers, and small-group discussion sessions within the Aspen Cyber Group.
[3] While one year is arbitrary, the underlying concept is the ratio of old vulnerabilities to new vulnerabilities. One year is a reasonable cutoff based on current remediation timelines, but it could be adjusted in the future as defenses improve.
[4] https://www.cisa.gov/national-critical-functions-set
This piece is part of Aspen Digital’s Made to Measure project working to stimulate debate on what building a national metrics program for cybersecurity ought to look like.
The views represented herein are those of the author(s) and do not necessarily reflect the views of the Aspen Institute, its programs, staff, volunteers, participants, or its trustees.