
For decades, attackers in cyberspace have had more advantages than defenders. Even with hundreds of billions of dollars in investments, countless patents, and non-stop effort, defenders continue to be overwhelmed.
Until this balance flips and defenders gain advantage, cyber risk will continue to escalate. The 2023 U.S. National Cybersecurity Strategy addressed this, calling for “shifting the advantage to defenders and perpetually frustrating the forces that would threaten” them. And while the 2026 Cyber Strategy for America does not repeat this specific goal, it does maintain a similar focus on improving innovation, accountability, and resilience.
Unfortunately, there has not been a way to measure if that balance is actually shifting. The defensive community is flooded with metrics, but most focus on the success or failure of enterprise cybersecurity, not the domain as a whole. Only a small number of metrics look across cyberspace, but they lack context and are rarely presented in a time series, so there has been no way to tell if defenders are improving.
Our latest research, based on a comprehensive framework of “winning,” looks for reductions of threat, vulnerability, and consequence, suggesting that defenders may finally be gaining momentum especially in software security.
To explain our findings, we first offer here a brief overview of the struggles in defense before examining what success looks like across a range of software security metrics with recommendations for building on these gains.
Defensive Struggles: Software and the Offense Advantage
Columbia University’s New York Cyber Task Force, framed “winning” in terms of who had more system-wide advantages, attackers or defenders.
In the earliest days of computing, defenders had the advantage: if you locked the door and vetted everyone with access to your computer, then it would not matter much if your hardware or software was insecure. As early as 1970 networking became more prevalent which meant software vulnerabilities went from being a local issue, only exploitable by those with access to the physical computer, to a global and systemic problem, accessible by any other Internet-connected computer.
In this new environment, it mattered a great deal that software was insecure. A 1972 report concluded that the design of “hardware and software is totally inadequate to withstand malicious attack” and that “unless security is designed into a system from its inception, there is little chance that it can be made secure by retrofit.” This insecurity is driven in large part by misaligned incentives. As Bruce Schneier noted as far back as 2003, “there are no real consequences for having bad security, or having low-quality software,” and software that prioritizes additional features and timely release dates is often rewarded, “even if they come at the expense of quality.”
This bleak history can lead many security practitioners and policymakers to pessimism or despair. But new data suggests defenders are finally making progress in software security.
What Software Security Data Tells Us
To measure software security, we looked at insights from a range of sources, including from Veracode’s State of Software Security Report, which has been reporting on software security for 15 years and now includes insights from over 1.3 million unique applications across over 2,000 customers.
We can report substantial progress across several important lines: 1) the severity of flaws, 2) their ability to be exploited, 3) the remediation speed of applying patches to the most severe flaws, 4) adversary speed and use of zero-day exploits, and 5) reductions in the use of memory-unsafe languages. The bad news is that security debt is increasing and Artificial Intelligence is not yet delivering more secure software. We will cover all these in turn.
Software has fewer severe flaws
According to Veracode data from software security testing, the level of flaws remains high: around 80% of applications were found to have at least one security flaw. However, the proportion of applications with a major flaw (that is, one in the OWASP Top 10 and CWE Top 25 lists of critical vulnerabilities) has been declining for years and at an increasing rate. From 2010 to 2020, there was an improvement of only about 1 percent a year. Since 2025, this has accelerated to 4 percent a year. Now over half of the software scanned lacks obvious, major flaws; up from less than a quarter in 2010.
Indeed, Veracode has reported that “every measurement” of security improved “over the last six years,” including a 30 percent improvement in software without a “flaw in an open-source library when they are first scanned,” which has since further improved. This last metric is especially useful, as it sheds light on both success at secure-by-design and open-source, third-party software and shows a reduction of risk from third-party code. This could be either from more-secure open-source code, or, more likely, quicker updates to remediated versions of the third-party packages used by software builders.
Software flaws are less exploitable
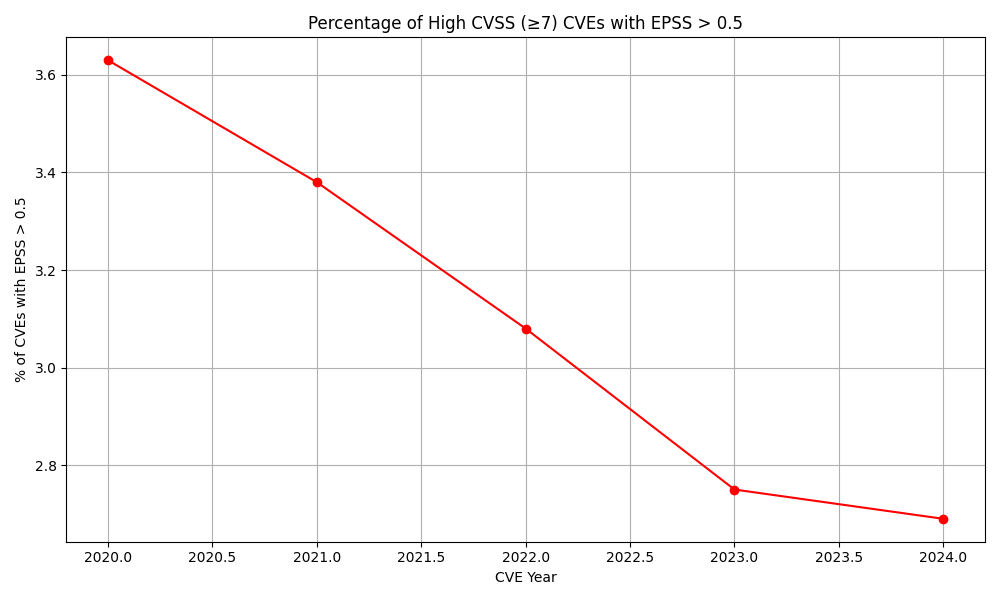
In addition to there being fewer severe vulnerabilities, the average vulnerability is less exploitable. According to data provided by the Exploit Prediction Scoring System, and analyzed by Veracode, the “exploit potential” of vulnerabilities has decreased by nearly a third in less than five years (see Figure 1.) Exploit potential is the likelihood that a given software vulnerability will be actively used by attackers in the real world. In other words, it estimates how attractive and feasible it is for attackers to create or use an exploit for that vulnerability.
Figure 1:
But are these gains offset by the fact that there are now far more applications out there?
It’s possible, but initial insights suggest this is not as severe as might be expected. If defenders were being flooded with insecure software, the numbers of exploits used by attackers might be expected to increase. But instead, the number of known exploitable vulnerabilities (KEVs) has been either flat (as reported by EPSS) or even decreasing (as reported by CISA).
Remediation speeds are improving
The previous statistics illustrate success in the software security development process to create less exploitable code. There are successes as well in how quickly enterprises fix their own code and apply patches from those developers.
Cobalt, a penetration testing company, reported substantial improvements in patching the most serious vulnerabilities, which “has decreased dramatically—from 112 days [in 2017] down to 37 days” in 2024. The proportion of serious findings discovered in penetration tests “declined by about half,” from 20 percent to 11 percent in that time.
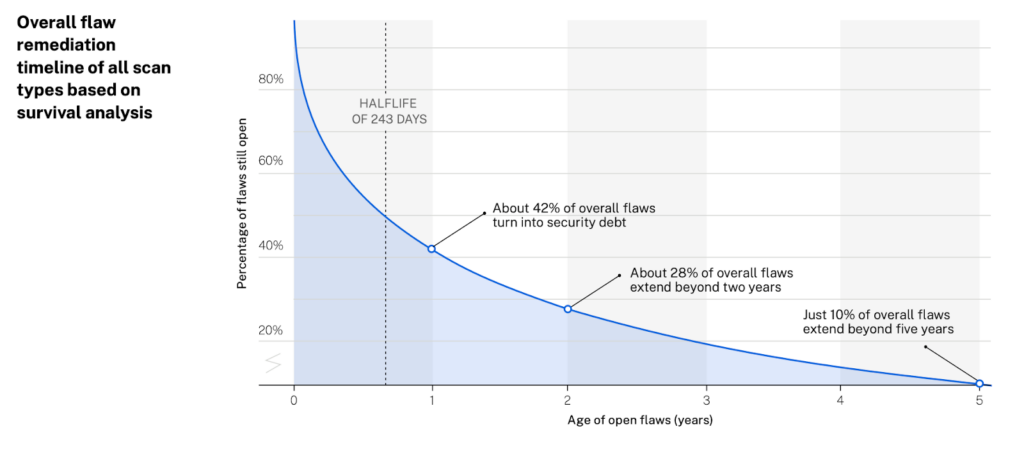
Veracode, using a different set of data, agrees that remediation times are still very long (with security bugs having a half-life of 243 days, see Figure 2) but those flaws are being fixed slightly faster, with a 4% year over year improvement from 2025.
Figure 2:
Attackers Are Forced to Exploit More Quickly and with Zero-Day Vulnerabilities
“Attackers have budgets and bosses too” and would prefer to use the same vulnerabilities for years at a time, as it is easier and cheaper. Instead their costs are increasing, because code is more secure and patched more quickly. They have been forced into exploiting newly disclosed vulnerabilities (the age of which has dropped from 63 days in 2018 to just five days in 2023) and using more zero-day vulnerabilities (from about 30 a year up to 2020 to roughly 85 a year since then, according to Google). Threat actors are having to use these expensive flaws, known only to them and not the defenders, rather than relying on older, commodity flaws and are having to replace them more quickly.
Applications with Third-Party Flaws
Another major improvement, just since last year, is an 11 percent reduction of flaws in third-party, open-source packages. The majority of critical severity secure debt still comes from third-party code, but the security of the software supply chain is at least improving, with 62 percent of applications having vulnerabilities in the open-source packages on which they rely.
Reduction in Memory Unsafe Languages
Only recently have “memory safe” languages become a priority, despite having been raised in the same 1972 report which introduced the concept of secure by design. While memory vulnerabilities typically represent about 70 percent of vulnerabilities that Microsoft fixes per year, there have been substantial improvements, with Google and Microsoft reducing by half the number of memory-safe vulnerabilities in Android.
The Bad News: Security DebT
Not all the trends are shifting in favor of more-secure software.
Though patch rates are improving, the security backlog is growing faster than remediation capacity can eliminate it. The percentage of applications with “security debt” (known vulnerabilities left unresolved for more than a year) has surged from 42 percent to 49 percent. Fully 60 percent of organizations have a critical debt (flaws that are both severe and highly exploitable) has grown by 20 percent. Much of this delay is from using engineering capacity to push new features rather than reducing security debt. So, even though patch rates are improving, defenders are falling farther behind in their security debt.
What About Generative AI? So far, generative AI is not substantially improving software security. Four independent studies (NYU, Wuhan, Stanford, Purdue) indicate that AI-generated code is slightly less secure than human code, likely due to it being trained on whatever open-source data happens to be available.
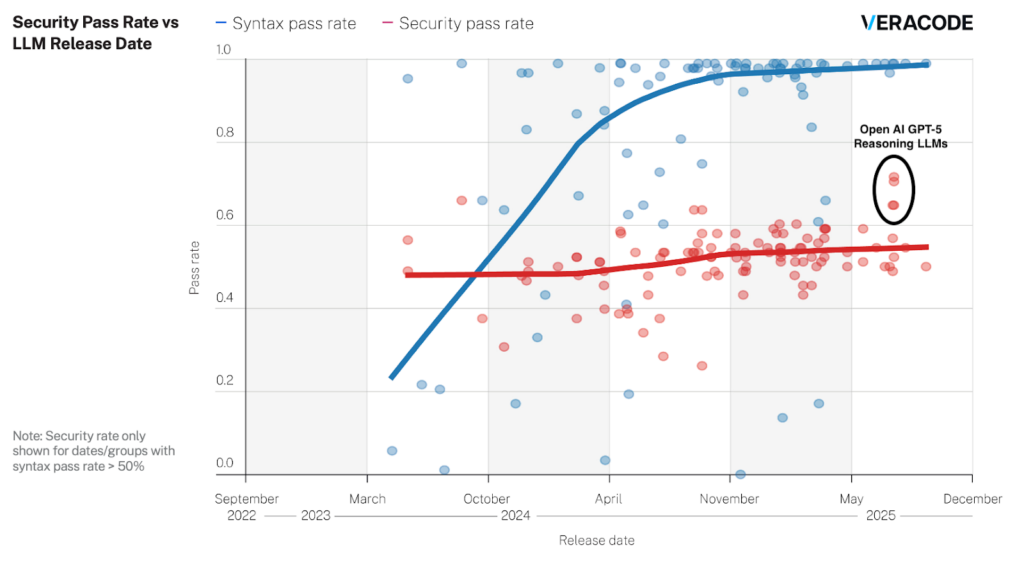
Veracode has confirmed this with its own study of 100 LLMs released over the past 25 months which found that while LLMs have made great strides in creating syntactically correct code, they have not improved in writing secure code, as shown in Figure 3. The average code completion task across four major programming languages produces a vulnerability 45% of the time. Yet there has been some recent improvement. The late 2025 reasoning models wrote insecure code only 30% of the time.
Figure 3:
That said, the potential good news is that it is far easier to train AI to code more securely than it is to train the perhaps 10 million software developers in the world, who are often trained to prioritize functionality over security.
How Things Can Get Better
Software is becoming far more secure across a range of important measurements. Years of patient investments and improvements finally seem to not only be paying off but making it more difficult for attackers.
To keep the progress going, this data suggests three key recommendations.
First, industry should further invest in ensuring that generative AI tools help create secure code. This not only helps their developers improve their own internal software security, but also the software of their users.
Second, governments and industry should continue to tackle flaws in third-party, open-source code. These investments will likely have an outsized payoff, as this seems to be an important source of remaining critical severity security debt.
Third, to truly succeed, defenders need to invest more in measuring these successes. Measurement is far simpler and less expensive yet has received comparatively little attention.
To improve measurement of ecosystem-level improvements, defenders and developers need to leverage data from existing sources, such as Veracode’s SoSS reports as well as those from Cyentia, EPSS, and others, using a common framework across threat, vulnerability, and consequence, such as the one in Columbia’s “winning” structure.
Those with relevant data should be encouraged by governments, industry associations, and other stakeholders to report defensibility relevant statistics, in time series and according to the framework. Such data can then be analyzed and collated into a periodic report to measure progress. These could, for example, be the basis of the annual posture reports required by Congress of the White House’s Office of the National Cyber Director.
Perhaps the most important activity for improving software security would be to move from metrics to goals. We might agree, for example, to drive the proportion of software with critical flaws from around 50 percent to 25 percent in five years and just 5 percent in ten years. The average age of vulnerabilities used in successful exploits should be less than a single year. Political and technical goals such as these can drive ideas and innovations giving a target for defenders and developers to aim for.
Success is possible, let us aim for it and measure our progress.
This piece is part of Aspen Digital’s Made to Measure project working to stimulate debate on what building a national metrics program for cybersecurity ought to look like.
The views represented herein are those of the author(s) and do not necessarily reflect the views of the Aspen Institute, its programs, staff, volunteers, participants, or its trustees.